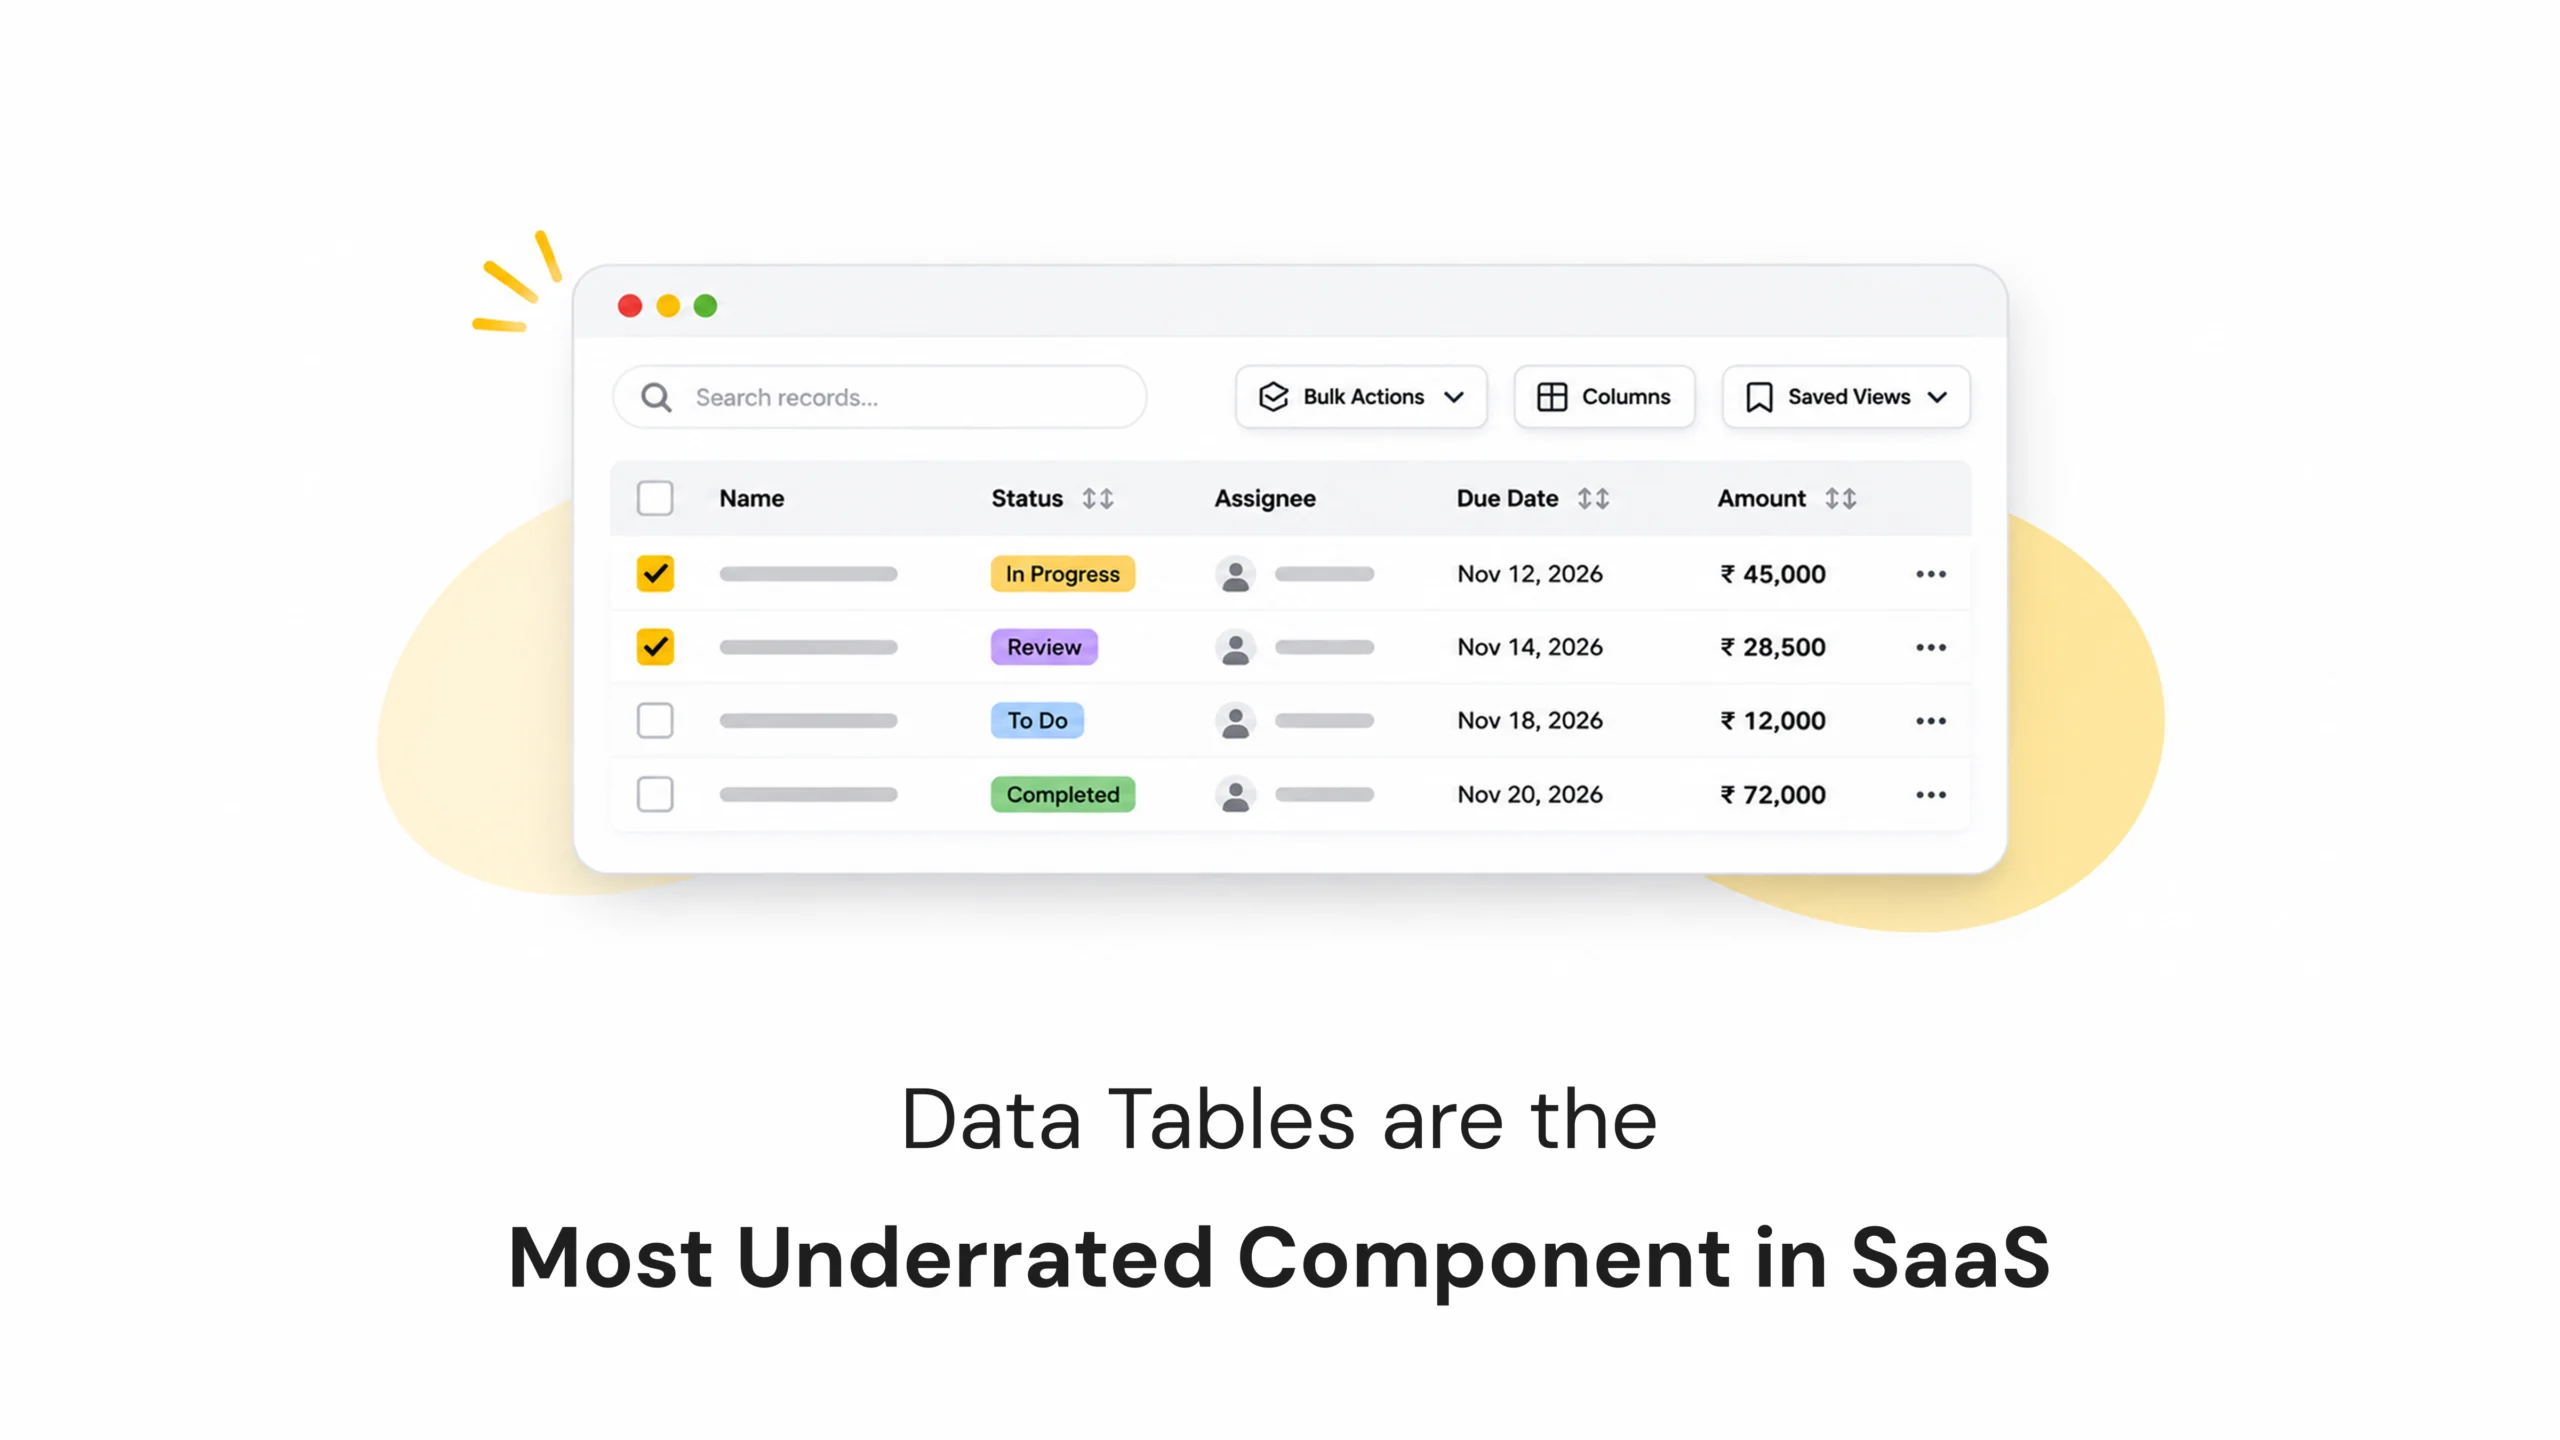
When we think about good SaaS design, dashboards, charts, cards, and visual reports usually get most of the attention.
But there’s one component that users interact with almost every day, and it rarely gets the same design attention: data tables.
Data Tables Are the Most Underrated Component in SaaS
- November 12, 2026
- Pavithra R
- 10:00 am
Views: 21
Introduction
When we think about good SaaS design, dashboards, charts, cards, and visual reports usually get most of the attention.
But there’s one component that users interact with almost every day, and it rarely gets the same design attention: data tables.
Think about project management tools, CRM platforms, financial dashboards, inventory systems, or analytics applications. Behind most of these products are tables that help users organise, compare, search, and manage large amounts of information.
For many users, tables aren’t just another part of the interface. They’re where most of their actual work happens.
Yet, table design is often treated as a simple task of arranging rows and columns.
A well-designed data table can make complex information easier to understand and manage. A poorly designed one can turn even a powerful SaaS product into a frustrating experience.
Why Data Tables Matter More Than We Think
In SaaS applications, users often work with large amounts of structured information.
A sales manager might need to review hundreds of customer records. A project manager may need to track tasks, deadlines, and team members. An operations team might spend hours checking inventory or updating records.
In these situations, users don’t need more decorative cards or complicated charts. They need information that’s easy to scan, compare, and act on.
That’s exactly where data tables become important.
Unlike cards, which are useful for highlighting individual pieces of information, tables allow users to view multiple records together and understand the relationships between them.
A good data table doesn’t just display information. It helps people get work done.
What Makes a Data Table Easy to Use?
A table may look simple, but several design decisions determine whether it works well in a real product.
Information Density: Finding the Right Balance
One common mistake in table design is trying to make everything look spacious.
Large row heights, excessive padding, and too much empty space might create a visually clean interface, but they also reduce the amount of information users can see at once.
For power users who work with hundreds of records, constantly scrolling through a table can become frustrating.
On the other hand, putting too much information into a small space makes the table difficult to read.
The goal is to find the right balance between readability and information density.
Use consistent spacing, clear typography, and well-organised columns to help users scan information without unnecessary scrolling.
Alignment: Make Information Easier to Compare
Alignment might seem like a small visual detail, but it has a significant impact on table usability.
Text values should generally be left-aligned, while numbers are often easier to compare when right-aligned. Status labels should follow a consistent position, and dates should use a standard format.
When information follows predictable alignment patterns, users can scan rows more quickly and compare values without extra effort.
Sortable Columns: Give Users Control
Not every user wants to view information in the same order.
A sales manager might want to sort customers by revenue, while a project manager may prefer sorting tasks by deadline.
Sortable columns allow users to organise information based on what matters to them.
Make sorting controls easy to identify and provide clear visual feedback about the active sorting order.
A small interaction like this can make a significant difference when working with large datasets.
Sticky Headers: Keep Context Visible
Imagine scrolling through hundreds of records and forgetting which column represents the information you’re looking at.
That’s where sticky headers help.
Keeping column headings visible while users scroll makes it easier to understand the data without returning to the top of the table.
For long tables, this small design decision can save time and reduce confusion.
Bulk Actions: Make Repetitive Work Faster
In many SaaS applications, users need to perform the same action on multiple records.
For example, an administrator may need to archive several accounts, update task statuses, or assign multiple records to a team member.
Selecting individual records and repeating the same action can become time-consuming.
Bulk actions solve this by allowing users to select multiple rows and perform an action together.
A good design should make selected rows visually clear and display relevant actions without overwhelming the interface.
Features That Make Data Tables More Powerful
Beyond displaying information, modern SaaS tables should help users interact with and manage their data efficiently.
Inline Editing
Users shouldn’t always have to open a separate page just to update a small piece of information.
Inline editing allows them to modify values directly within the table.
For example, changing a task status, updating a due date, or editing a customer name can happen without leaving the current view.
The important part is making editable fields easy to recognise and providing clear feedback when changes are saved.
Column Customisation
Different users care about different information.
A sales team may prioritise customer names, deal values, and follow-up dates. An operations team may need status, location, and assigned personnel.
Column customisation allows users to show, hide, or rearrange columns based on their workflow.
This makes the same table more useful for different roles without creating completely separate interfaces.
Saved Views
Sometimes users repeatedly apply the same filters and sorting preferences.
Saved views allow them to store these configurations and return to them whenever needed.
For example, a project manager might save views such as:
- My Active Tasks
- Overdue Projects
- Pending Approvals
- Completed Tasks
Instead of rebuilding the same filters every time, users can access the information they need with a single selection.
Common Data Table Design Mistakes
Even well-designed SaaS products can struggle with table usability when important details are overlooked.
Truncated Information Without Context
Long names, email addresses, and descriptions are often cut off to save space. Truncation can be useful, but users should have a way to access the complete information through tooltips, expandable content, or detail views.
Poor Keyboard Accessibility
Not everyone interacts with a table using a mouse. Users should be able to navigate interactive elements, select rows, and access important actions using a keyboard.
Unreadable Numbers
Numbers such as prices, percentages, quantities, and financial values need consistent formatting and alignment. Poorly formatted data makes comparison difficult and increases the chance of mistakes.
Too Many Actions in Every Row
Showing every possible action beside every record creates visual clutter. Keep common actions accessible and group less frequently used options into contextual menus.
No Clear Loading or Empty States
Tables should communicate what is happening when data is loading, when no records are available, or when a search returns no results. Without these states, users may assume something is broken.
How to Design Better Data Tables for SaaS Products
Creating a useful data table starts with understanding how people actually work with information.
Before designing, consider a few important questions:
- What information do users need to see first?
- Which columns are essential to their daily tasks?
- How frequently do they sort, filter, or update records?
- Do different user roles need different table views?
- Which actions should be available directly within the table?
From there, focus on a clear information hierarchy, consistent spacing, readable typography, useful interactions, and accessible controls.
Most importantly, test the table with real users and realistic amounts of data.
A table that looks perfect with five sample rows may behave very differently when it contains hundreds of records.
Good table design should work beyond the design file.
The Takeaway: Design for the Work Users Actually Do
Data tables may not be the most visually exciting part of a SaaS product, but they’re often among the most important.
Users depend on them to review information, manage records, compare values, and complete everyday tasks.
That’s why table design deserves the same attention as dashboards, navigation, and other major interface components.
The goal isn’t to make tables look impressive. It’s to make them predictable, flexible, readable, and efficient.
Great SaaS design isn’t just about what looks good on a dashboard. It’s also about how easily users can get their everyday work done.
Sometimes, the most valuable design improvements happen in the components we tend to overlook.
Latest Blogs
Work With Us to Create Impactful Digital Experiences
FAQs
Why are data tables important in SaaS applications?
Data tables help users organise, compare, filter, and manage large amounts of structured information. They’re essential in products such as CRM platforms, project management tools, financial systems, and inventory applications.
What makes a good data table design?
A good data table combines readable typography, proper alignment, balanced information density, sortable columns, clear navigation, and useful actions. It should make information easy to scan and tasks easy to complete.
What is the difference between a data table and a data grid?
A data table primarily displays structured information in rows and columns. A data grid typically offers more interactive functionality, such as inline editing, cell selection, keyboard navigation, and advanced data manipulation.
What are the best practices for designing SaaS data tables?
Use consistent spacing and alignment, provide sorting and filtering, support bulk actions, allow useful column customisation, ensure keyboard accessibility, and test with realistic datasets. Prioritise the tasks users perform most frequently.